
The visual research I decided to explore is related to Westminster. As I lived in its borough, I wanted to analyse some interesting facts which could be of use for locals and tourists passing by.
Initially, I decided to find 5 pieces of information.

House price growth between 1996-2016

Female & male population
Number of public toilets
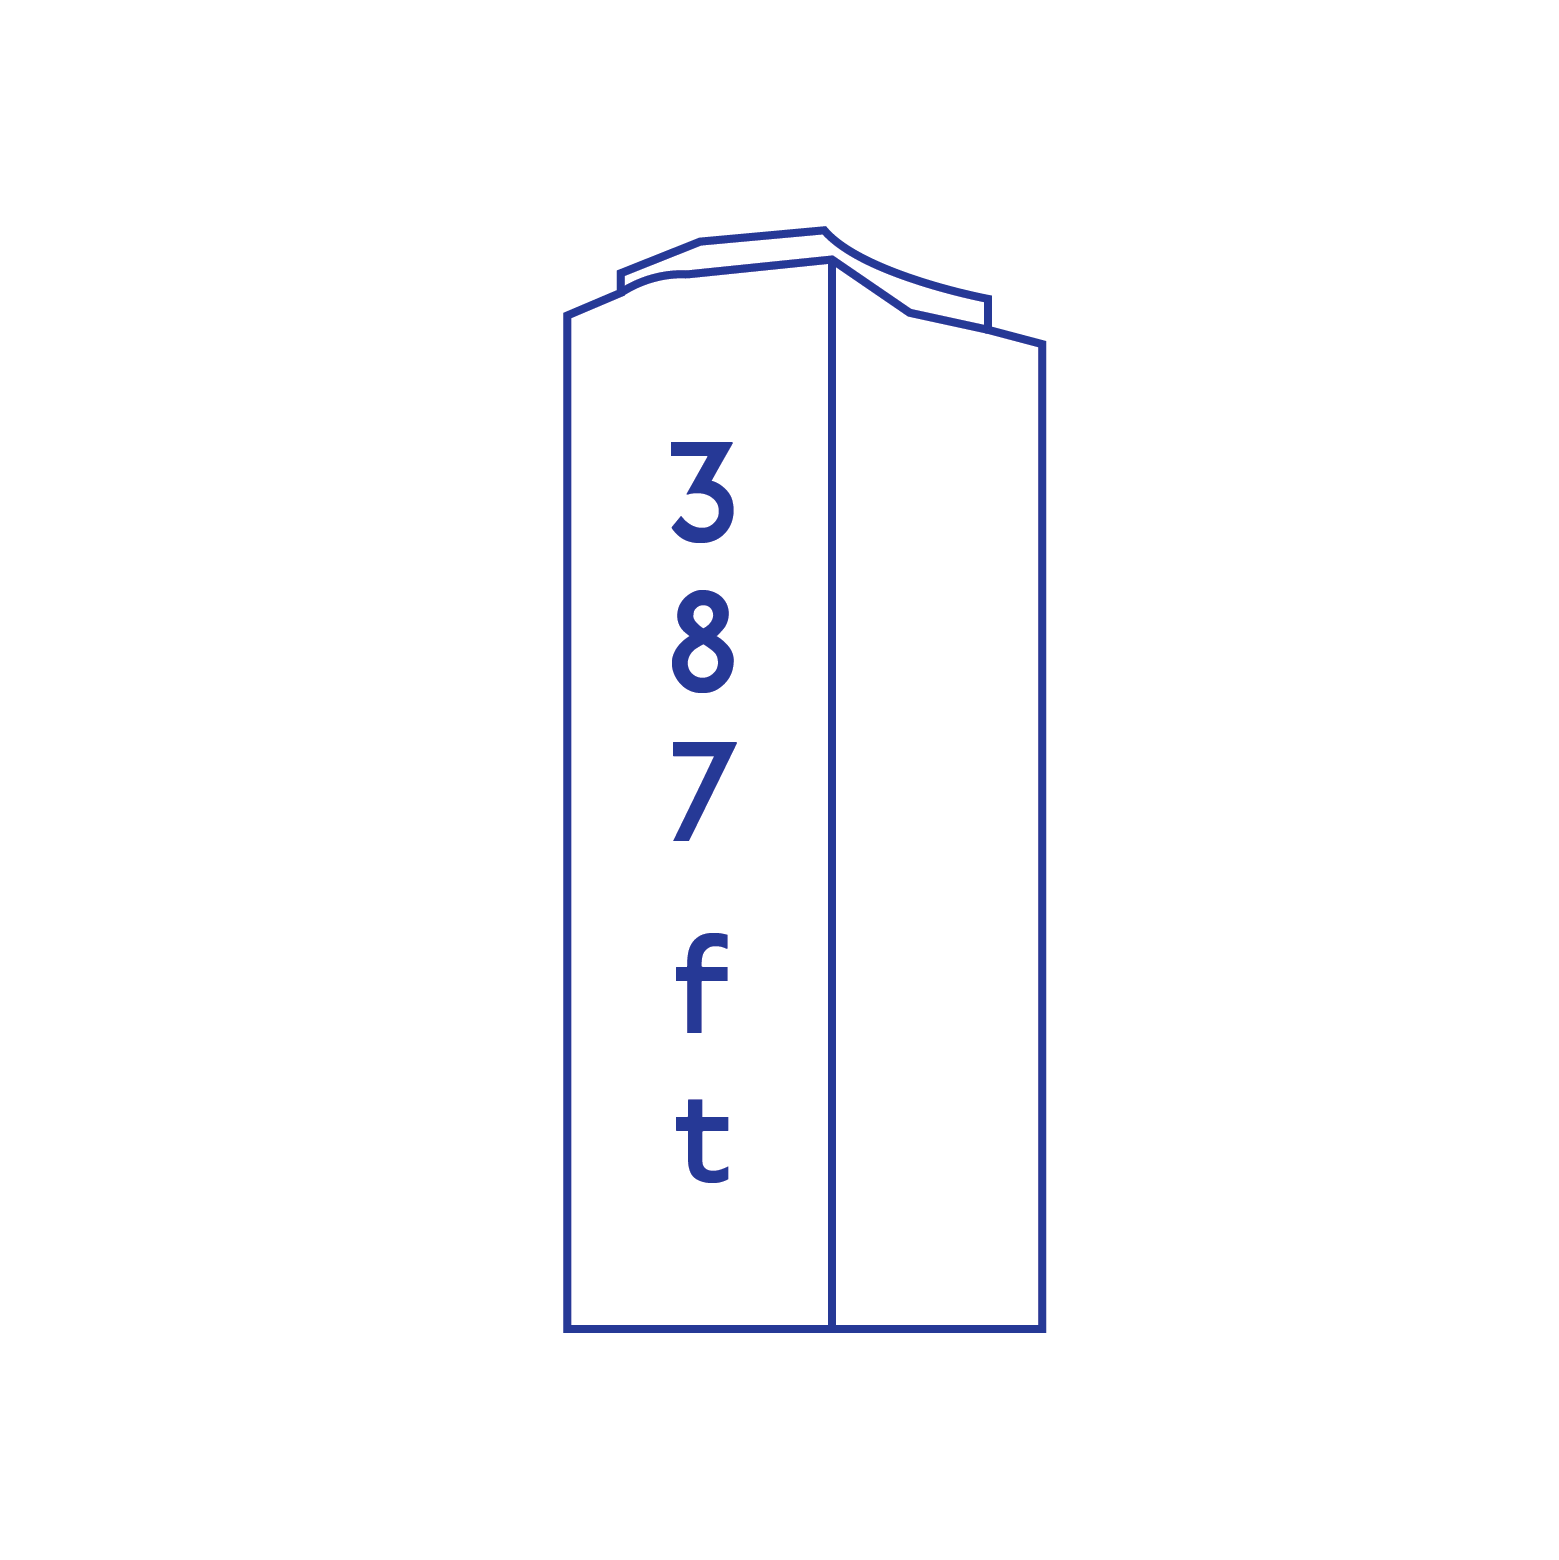
The tallest building
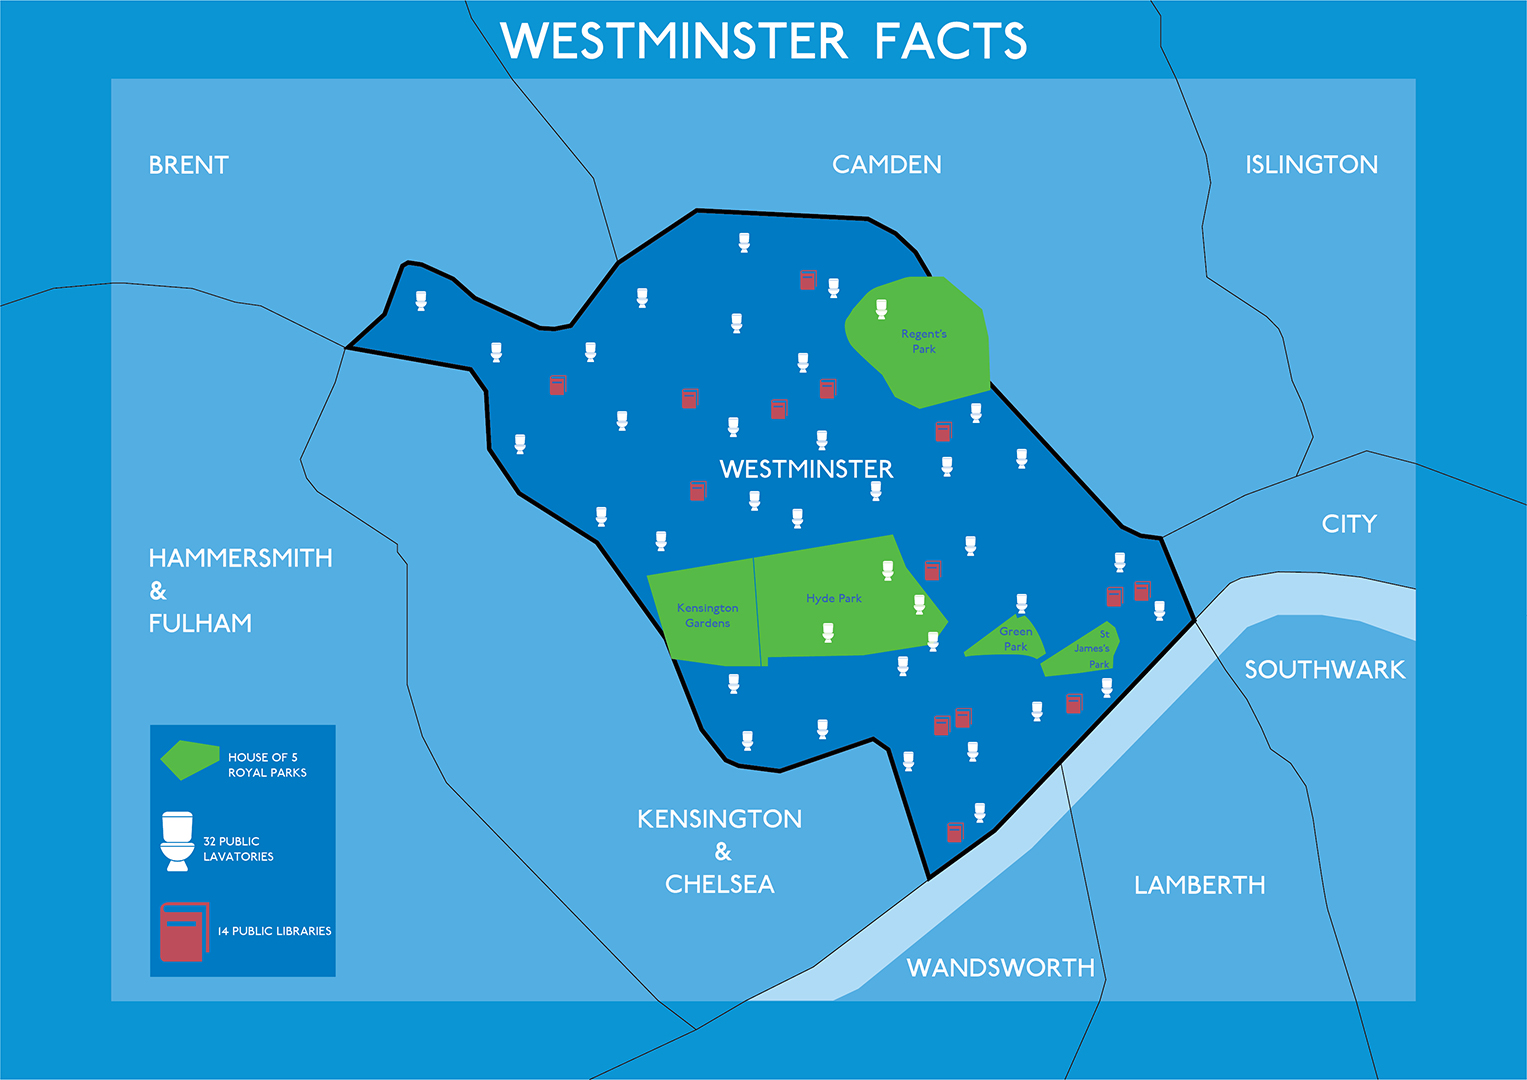
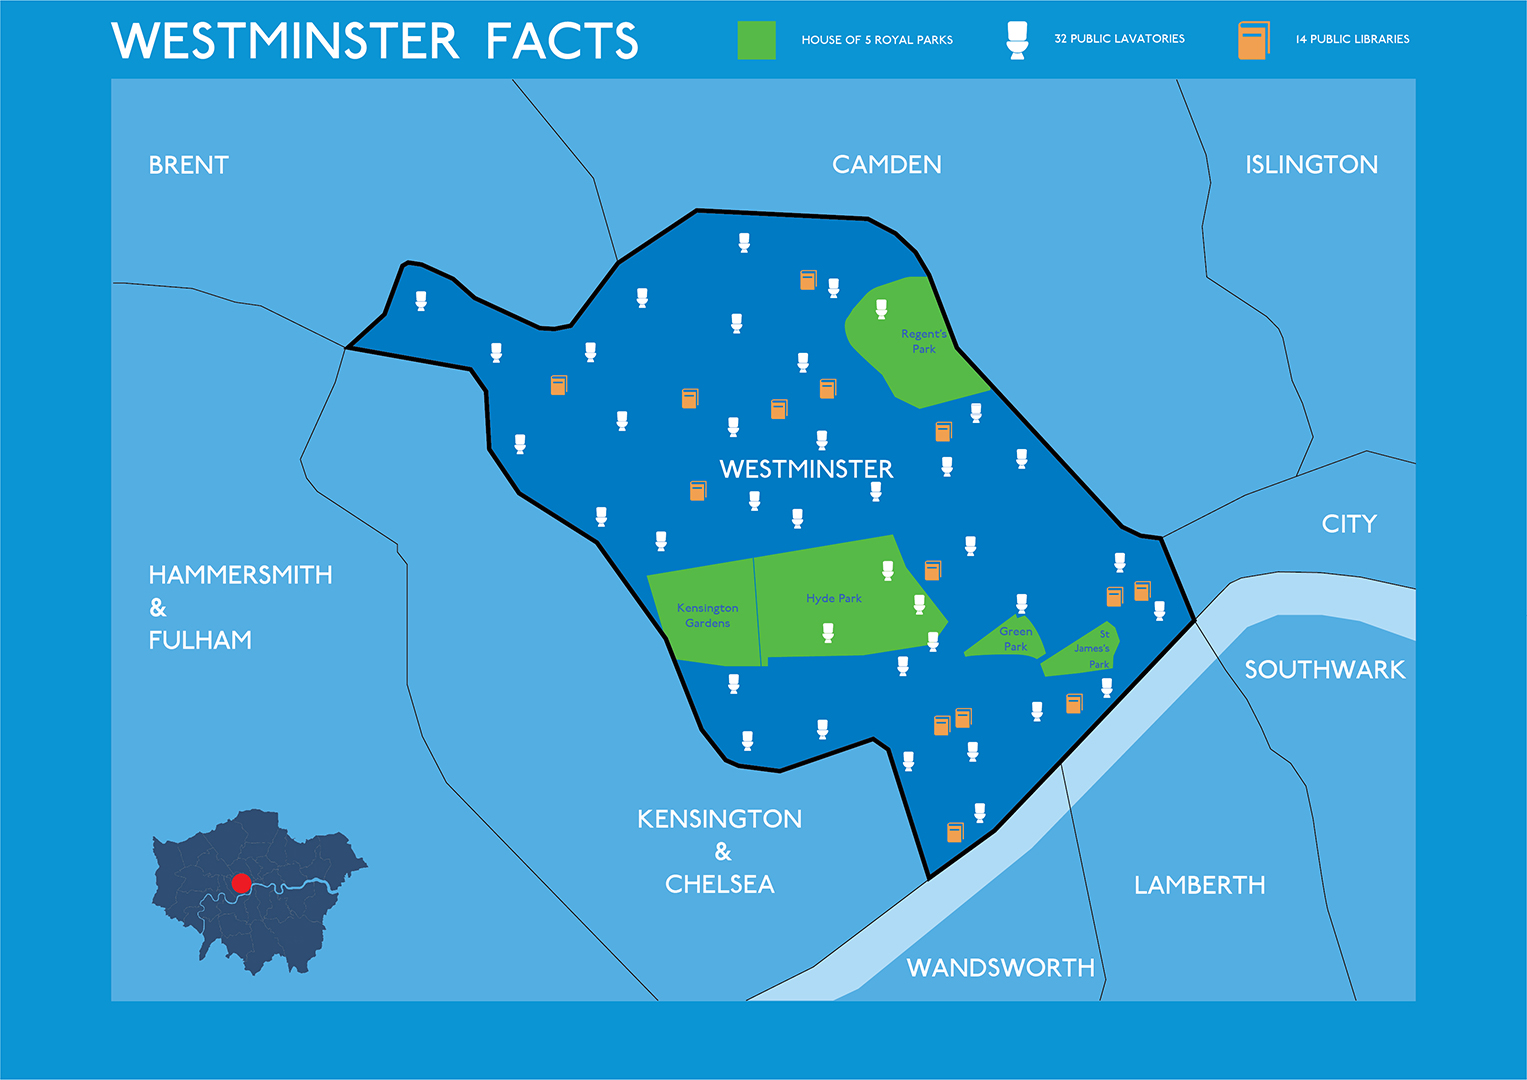
I tried to combine all this information in a map of Westminster. The first attempt was disorganised and didn’t have a good hierarchy to easily understand what was going on in the visual, in addition, the colour palette was too strong and not very pleasing for the eye. That being said, I thought that the information provided was too much and it didn’t really relate with one another.

Subsequently, I researched more on what Westminster has to offer to the public and I found out that there are 14 public libraries.
That being found, I chose to add this information in the visual and remove data which wouldn’t relate to a similar subject e.g. the house price growth between 1996-2016 and the tallest building in the borough.

2. Colour palette changes

3. Content changes

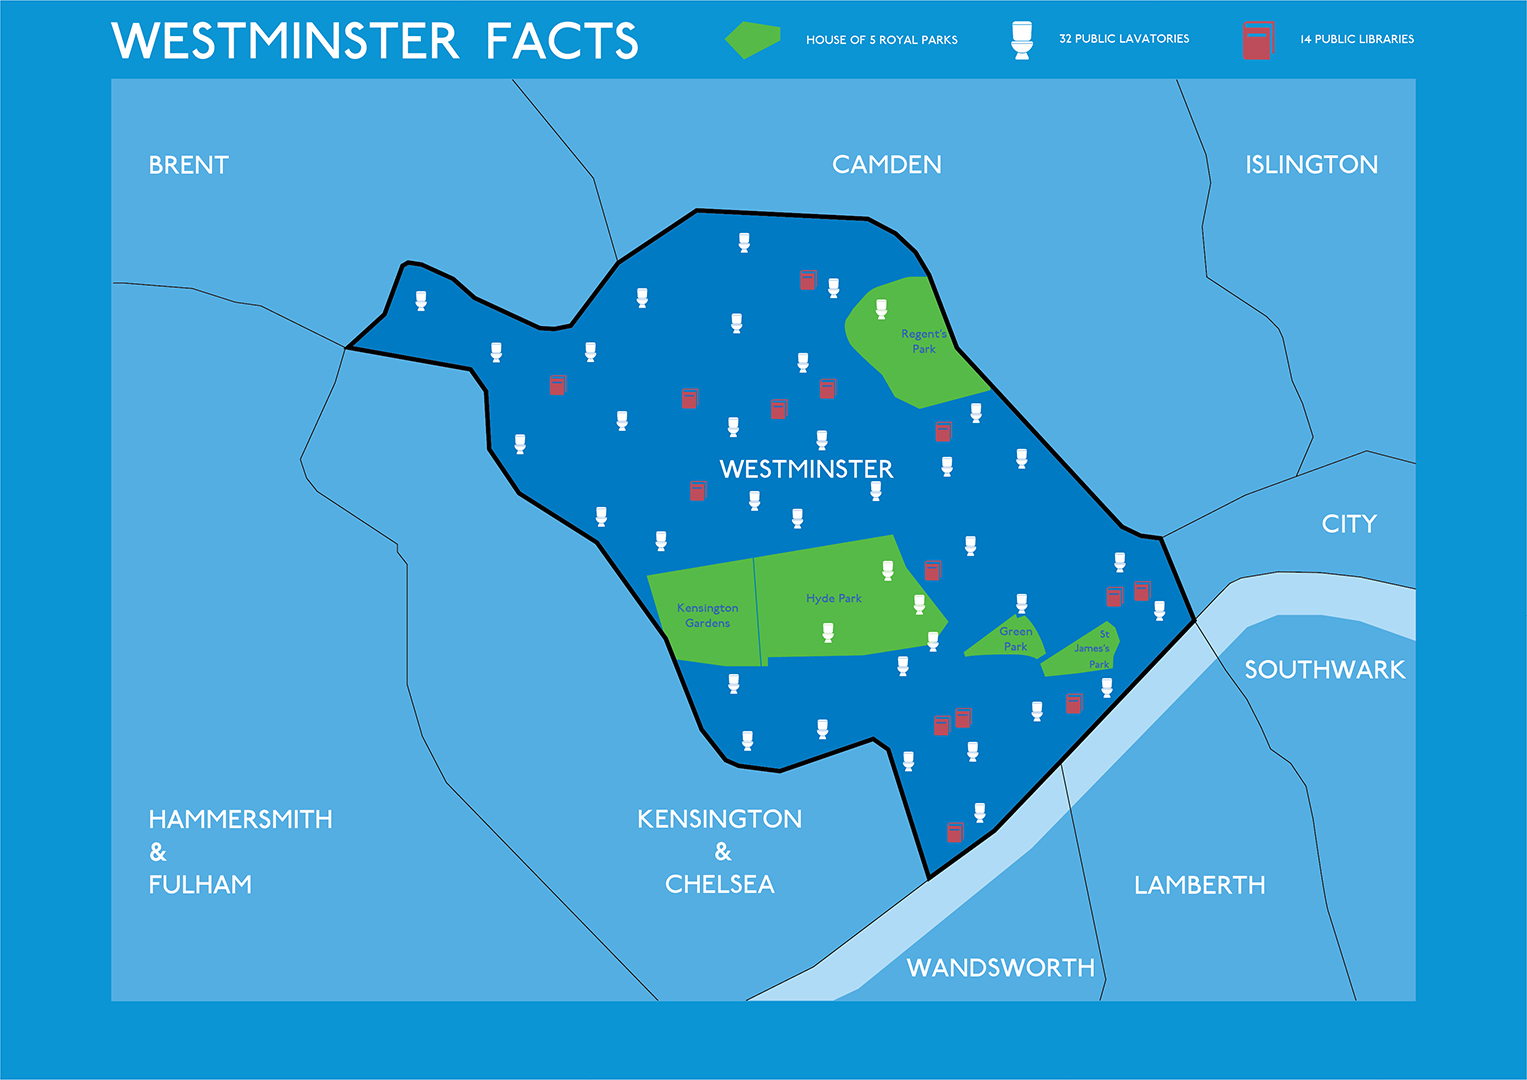
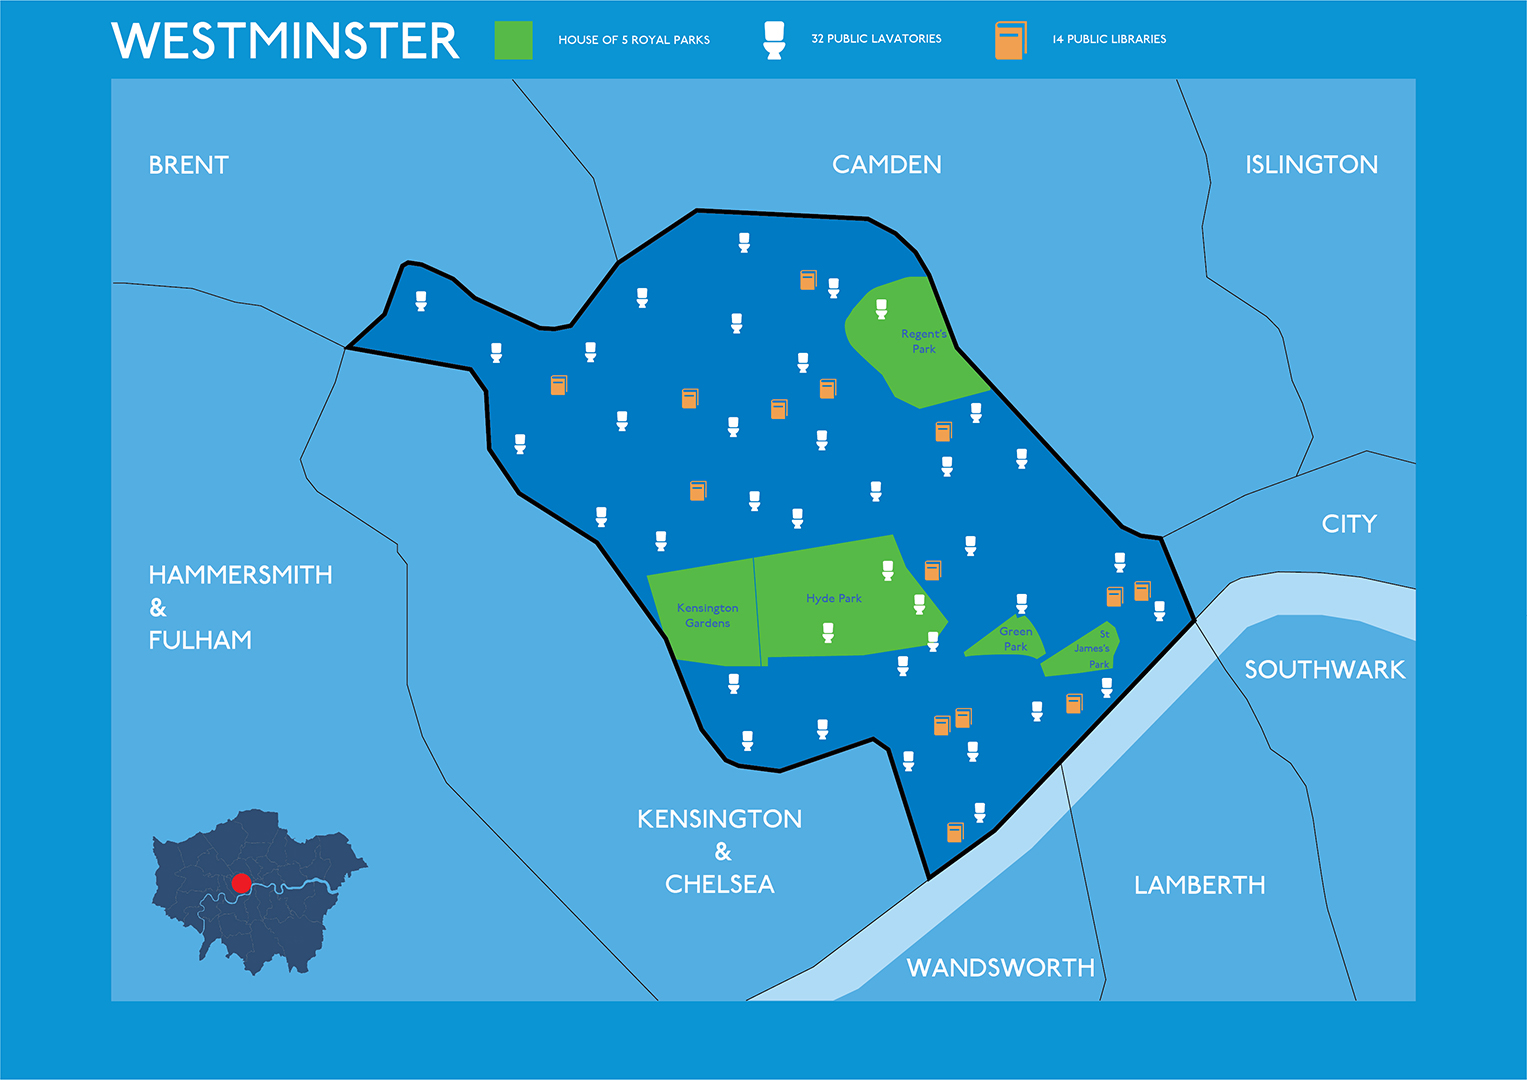
4. Colour paletter & hierarchy changes

5. Framing space, visual style consistency
6-7-8-9. Minor changes

10. Possible outcome N°1

11. Possible outcome N°2

